Pristatymai
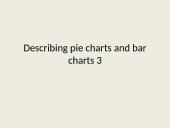
Description of graphs, bar charts and pie charts


A line graph represents changes over a period of time.
A multiple line graph shows two or more sets of data and compares items of the same category.
• Introduce the line graph.
• This double line graph shows changes in the numbers of people entering and leaving Lithuania during the period between 2005 and 2014.
• Note what the x and y axes represent.
• The y/vertical axis shows changes in immigration and emigration rates.
• The x axis/horizontal represents time scale.
How to describe a line graph Step 3
• Describe the overall trend
• Overall, emigration rates decreased significantly whereas immigration rates tend to increase.
How to describe a line graph Step 4
• Identify the most obvious changes of the line.
• Regarding emigration, it grew steeply from 2004 and increased considerably in 2005. After a downward trend between 2005 and 2008, a sharp increase is visible in 2008, peaking at over 80,000 in 2010. From 2010, emigration started to decline steadily and fell below 40, 000 at the end of the observed period. Emigration decreased by half, compared with over 80,000 in 2010. As far as immigration is concerned, it grew slowly from 2004 to 2008. Immigration started to decline in 2008, and after having reached a low in 2010, it grew steadily. In 2014 it was over 20,000, compared with less than 10,000 in
How to describe a line graph Step 5
• Summarize/compare the trends
• All in all, the number of people entering the country is increasing, while the number of people leaving the country is decreasing
Vocabulary bank
• This line graph depicts…
• The line graph shows…
• The graph indicates…
• From the graph it is clear…
• As it can be seen from the graph…
• The most obvious trend in this chart/graph is…
• Increase/grow/rise significantly/steadily/sharply
• Fall/decrease/drop sharply/slightly/rapidly
• Twice as much/more than/less than/the same amount/
• Fluctuate/peak/remain stable
Bar charts/graphs are used...
Šį darbą sudaro 1016 žodžiai, tikrai rasi tai, ko ieškai!
★ Klientai rekomenduoja
Šį rašto darbą rekomenduoja mūsų klientai. Ką tai reiškia?
Mūsų svetainėje pateikiama dešimtys tūkstančių skirtingų rašto darbų, kuriuos įkėlė daugybė moksleivių ir studentų su skirtingais gabumais. Būtent šis rašto darbas yra patikrintas specialistų ir rekomenduojamas kitų klientų, kurie po atsisiuntimo įvertino šį mokslo darbą teigiamai. Todėl galite būti tikri, kad šis pasirinkimas geriausias!
Norint atsisiųsti šį darbą spausk ☞ Peržiūrėti darbą mygtuką!
- Anglų kalbos pristatymas
- 23 psl., (1016 ž.)
- Skaidrės 412 KB
- Lygis: Mokyklinis
Mūsų mokslo darbų bazėje yra daugybė įvairių mokslo darbų, todėl tikrai atrasi sau tinkamą!
![]() Panašūs darbai
Panašūs darbai


Privalumai
Atsisiuntei rašto darbą ir neradai jame reikalingos informacijos? Pakeisime jį kitu nemokamai.
Pirkdamas daugiau nei vieną darbą, nuo sekančių darbų gausi 25% nuolaidą.
Išsirink norimus rašto darbus ir gauk juos akimirksniu po sėkmingo apmokėjimo!
Atsiliepimai


